Please provide your information and submit this form. Our team will be in touch with you shortly.

Investment Management
5 SMART INVESTING PRINCIPLES
PRESENTATION
 0 out of 15

There is no shortage of self-help material available for people looking to boost their investing knowledge. Between television programs, magazines, and other information sources, you can read about “The Best” this and “The Most Important” that. It can be easy to get confused, especially when you get conflicting ideas.
Understanding a few key investment principles can be a great place to start. It can give you a better framework to understand the information as you take in the ideas. It can also provide context for evaluating the concepts and strategies suggested.
This presentation goes through five smart investing principles. These are key concepts that could help you understand what it takes to create an investment portfolio that’s designed to pursue your investment goals.
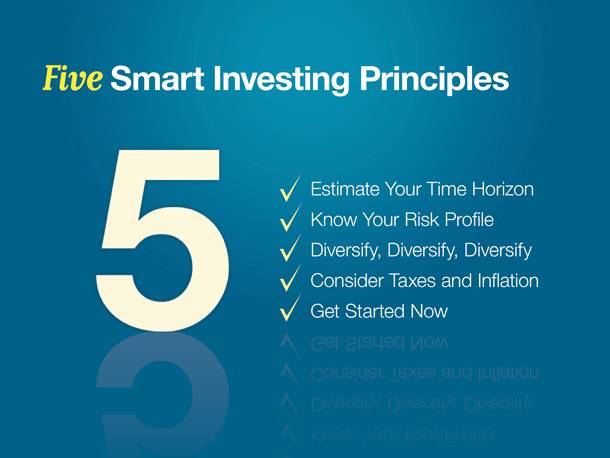
There are five smart investing principles that are helpful to understand if you want to potentially break the cycle of buying high and selling low. Are there other investing principles? Absolutely. But for the purposes of our discussion today, we’re going to focus on the five that we believe are critical to understand.
First, estimate your time horizon. Is your investment horizon three years away or 30 years?
Second, know your risk profile. Can you tolerate big swings in the value of your investments, or do you prefer less volatility? Knowing your risk profile is an important step as you consider various types of investments.
Third, diversify, diversify, diversify. This one’s so important we listed it three times.
Fourth, consider the effects of taxes and inflation.
And finally, get started now. Take the initiative and get going. If you learn nothing else today, please understand the importance of getting started now. When it comes to pursuing investment goals, the more time you have the better.
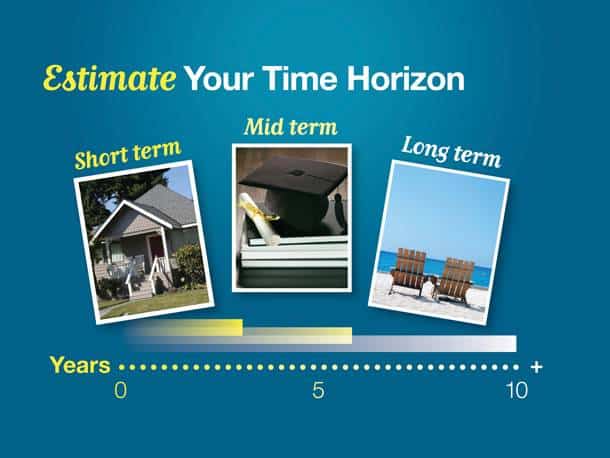
Let’s take a look at our first principle, estimating your time horizon.
Generally, if your time horizon is short, you may be more comfortable with a more conservative investing approach. Certain investments can be volatile and may not be appropriate if you have a short-term horizon.
If your child is headed to college in five years, many people would say you have a mid-term horizon. You
may want to be less conservative with your investing approach and have a larger exposure to equity investments.
When you have a long-term horizon, you may consider adopting a more aggressive approach. If you intend to retire in 10–15 years, having a larger exposure to stock investments may make more sense. One way to lower your exposure to stock market risk is by investing for the long term, which gives your money time to recover from periods of market fluctuations and loss. Of course, past performance is no guarantee of future results.
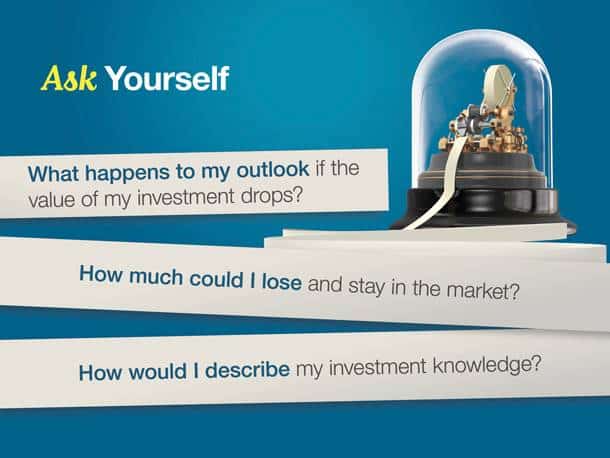
Let’s move from estimating your time frame to our next principle: know your risk profile. How much tolerance do you have for risk?
It’s easy to say, “I can handle a high level of risk,” but that may or may not be the case. It’s a good idea to ask yourself some pointed questions and be honest with the answers.
What happens to my outlook if the value of my investment drops?
How much could I lose and stay in the market?
It’s also helpful to ask yourself, “How would I describe my investment knowledge?” There are some television programs that help people understand investments and how markets work. But if most of your investment knowledge has come from television personalities, you may want to consider getting a second opinion on your approach.

Here’s another helpful series of questions to ask yourself.
What would you rather have, $500 right now or a 50% chance at $2,000? Many people go for the $2,000, and rightfully so. Since you have a 50/50 chance, a decision tree shows the $2,000 answer carries a potential value of $1,000.
But let’s add a few zeros and see if that changes your perspective.
What would you rather have, $50,000 right now or a 50% chance at $200,000? The decision tree says the opportunity to win $200,000 has the highest potential value. But in reality, many people second-guess that decision because $50,000 is a lot of money.
Remember, there is no correct answer to the questions. They simply help you better understand the concept of risk.
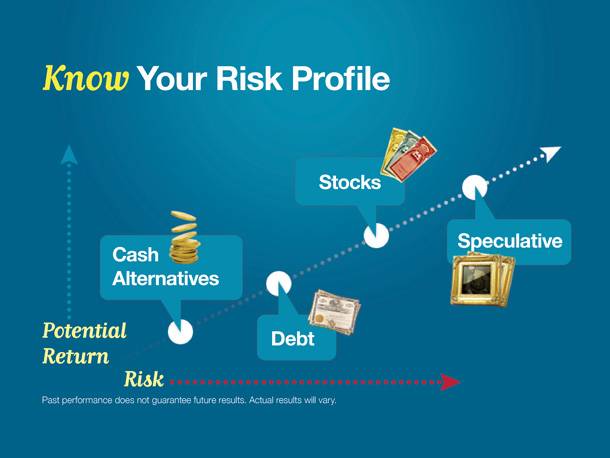
Investment risk can be managed, but it can’t be eliminated entirely. All investments carry some level of risk. And in general, the greater the risk an investment carries, the higher its potential return. This illustration may help you understand how this works. Along the horizontal axis is risk—the lowest level is on the left and the highest is on the right. Along the vertical axis is potential return—the lowest is at the bottom and the highest is on top. Different types of investments fall into different places on this graph. Keep in mind, however, that past performance does not guarantee future results. Actual results will vary. With the lowest risk—and the lowest potential return—are cash alternatives, such as certificates of deposit, which are generally considered to be relatively “safe“ investments. If you sell before a CD reaches maturity, you may be subject to penalties. Bank savings accounts and CDs are FDIC insured up to $250,000 per depositor per institution and generally provide a fixed rate of return. Traditional CDs offer a fixed rate of return, whereas both the principal and yield of investment securities will fluctuate with changes in market conditions. Further up on the graph are debt instruments, such as government bonds. Debt instruments offer slightly higher return, but at slightly higher risk. It’s important to remember that bond prices, including on government bonds, rise and fall daily. If a bond is held to maturity, a bond holder will receive the interest payments due plus original principal, barring default by the issuer. Return of principal is not guaranteed. Next are stock investments, which offer the potential for higher return, but they also have a higher risk. The return and principal value of stock prices will fluctuate as market conditions change. And shares, when sold, may be worth more or less than their original cost. At the top are speculative tools. Speculative tools are not appropriate for every investor. They carry a high level of risk and, when sold, may have little or no value. Consider working with an investment professional to better assess the risks associated with a speculative tool.
Past performance does not guarantee future results. Actual results will vary.
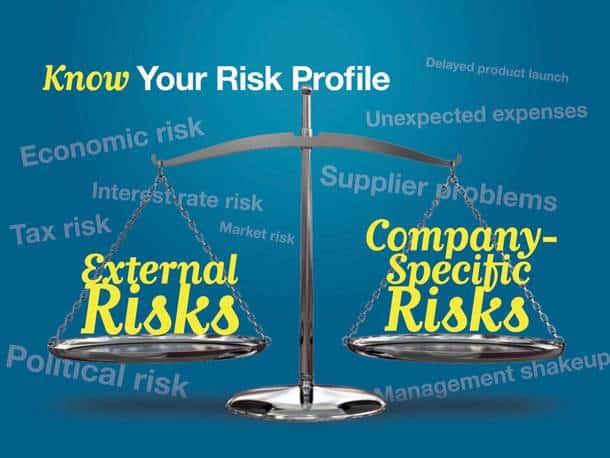
Risk can come from different sources.
For example, there are external risks that may influence the price of a stock. That is, sources of risk that are outside a company’s influence. These may include economic risk, market risk, interest-rate risk, political risk, and tax risk.
Let’s take a closer look at one of those risks: market risk. If the overall stock market trends lower, many stock prices would be expected to trend lower as well. Conversely, if the market trends higher, many stock prices may move higher.
It’s like the old expression, “A rising tide lifts all boats.”
On the other side of the scale are company-specific risks. These are risks that are unique to the company, such as a delayed product launch, unexpected expenses, supplier problems, and a management shakeup. By buying stock in an individual company, you are agreeing to accept a certain amount of company-specific risk.
Next investment principle: diversification.
Diversification suggests that a portfolio of different kinds of investments, on average, may potentially yield a higher return and pose less risk than any individual investment.
In short, diversification helps manage the company-specific risks we illustrated on the previous image.
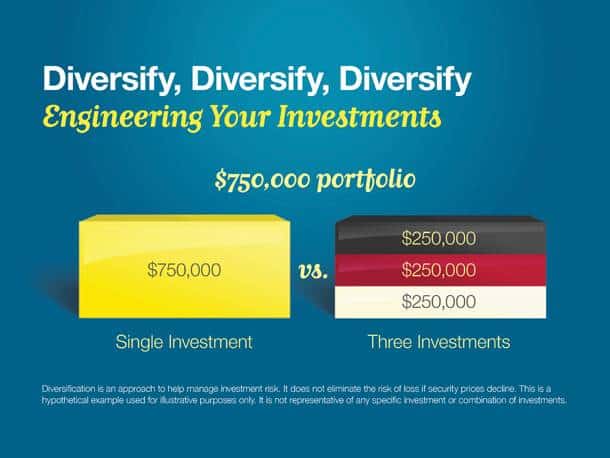
Let’s assume we have an investor who has $750,000 to invest.
On the left is a hypothetical example of $750,000 placed into a single investment. On the right is a hypothetical example of the same amount divided between three investments.
Diversification is an approach to help manage investment risk. It does not eliminate the risk of loss if security prices decline. This is a hypothetical example used for illustrative purposes only. It is not representative of any specific investment or combination of investments.
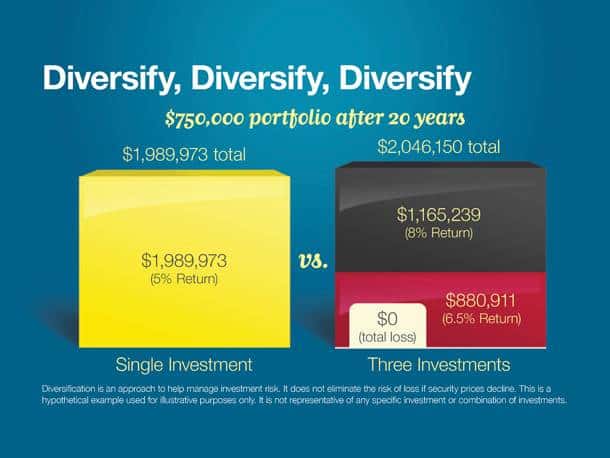
After 20 years, the single investment, assuming a 5% annual return, will have grown to roughly $2 million.
During the same period, our diversified portfolio will have grown to just over $2 million. And in this example, we’re assuming that one of the investments was a total loss; that is, it was worth nothing at the end of 20 years.
Diversification is an approach to help manage investment risk. It does not eliminate the risk of loss if security prices decline. This is a hypothetical example used for illustrative purposes only. It is not representative of any specific investment or combination of investments.
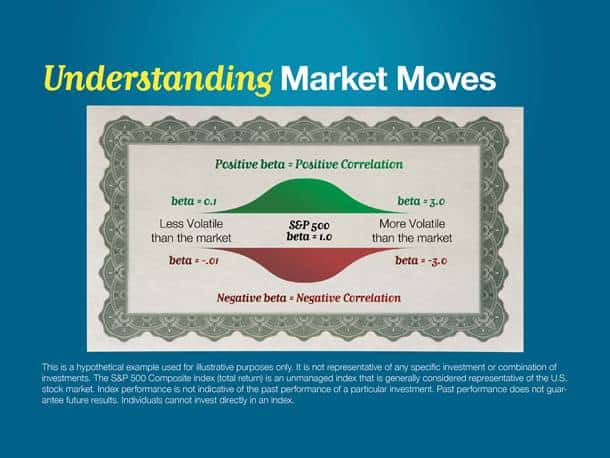
There’s more to diversification than simply spreading your money around to different investments. In principle, you want to select investments that have a low correlation with each other. That is, investments that don’t tend to behave the same in a market environment.
One measure of correlation is called the “beta.”
Beta is a measure of a stock’s correlation with the overall stock market. Beta is a measure of how likely a stock is to move up and down as the overall stock market moves up and down.
In this example, we’re using the Standard & Poor’s 500 Composite Index (total return) to represent the market; so it has a beta of one. The S&P 500 is an unmanaged index that is generally considered representative of the U.S. stock market. Index performance is not indicative of the past performance of a particular investment. Individuals cannot invest directly in an index.
A stock price that varies more widely than the S&P 500 would be expected to have a beta that is greater than one. A stock with a beta of two, for example, will rise and fall, on average, by twice as much as the wider stock market. So, if the S&P 500 falls by a hypothetical 1%, a stock with a beta of 2 would be expected to drop by 2%.
Beta can also be negative. For example, a stock with a beta of negative one would expect to see its value fall by 1% when the market rises by 1%.
What we have reviewed are hypothetical examples used for illustrative purposes only. They are not representative of any specific investment. Past performance does not guarantee future results.

Another investing principle is the consideration of taxes and inflation.
This chart shows how many days the average American worked in 2018 to pay their tax obligation. Americans pay income taxes, Social Security taxes, sales and excise taxes, and property taxes.
The same concept occurs when you put your money to work. Taxes may take part of your return.
So when you are looking at the return on an investment, ask yourself, “What is my return after taxes?”
Source: Tax Foundation, 2018.
Another silent thief you have to watch out for is the effect of rising prices, otherwise known as inflation.
Over the long term, inflation erodes the purchasing power of your income and wealth.
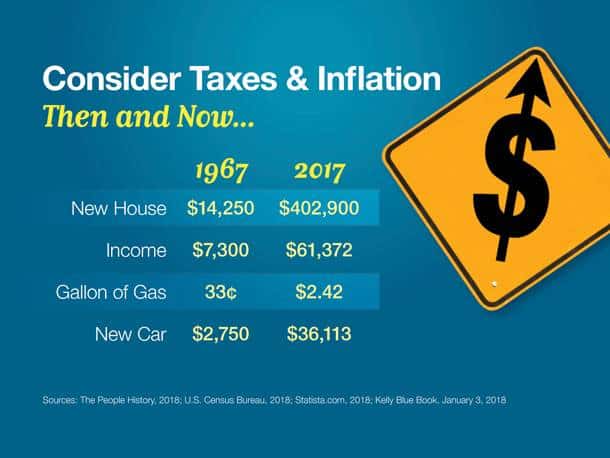
It’s easy to see; just look at prices from 1967.
In 1967, a new house cost $14,250. Income was $7,300 per year. A gallon of gas cost 33 cents. And the average cost of a new car was $2,750.
In 2017, the average price of a new home was $402,900. The median income was $61,372 per year. The average price for a gallon of gas was $2.42, and the average price of a new car was $36,113.
Sources: The People History, 2018; U.S. Census Bureau, 2018; Statista.com, 2018; Kelly Blue Book, January 3, 2018
Our last investment principle is get started now. Procrastination can be costly.
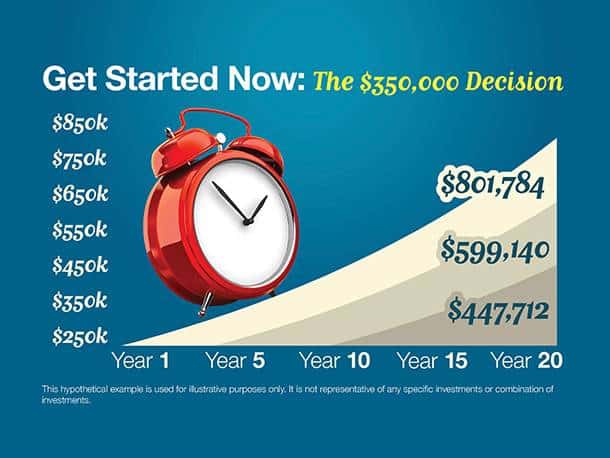
For example, if you were to deposit $250,000 in an account earning 6%, at the end of 20 years your account would be worth $801,784.
If you waited five years before starting your investment program, the $250,000 would have 15 years to work and would grow to $599,140.
And if you waited 10 years, then started your program, you’d only end up with $447,712.
Put another way, waiting 10 years to start was a $350,000 decision.
Keep in mind, this is a hypothetical example used for illustrative purposes only. It is not representative of any specific investment or combination of investments.

When you’re ready to move forward, we’ve identified some specific action items to help you get started.
First, put together a personal income statement. You want to identify all your sources of income and where your money is going.
Next, put together a simple balance sheet. This should give you a good snapshot of your assets and liabilities.
Identify your long-term, medium-term, and short-term financial goals.
Then, be honest with yourself about your tolerance for risk. Can you stomach big market swings or are you more comfortable with less volatility? Once you have sized up your personal finances, you may be ready to discuss your situation with a professional.

Following a few smart investment principles can make your investment efforts much more effective. But it doesn’t end there. Effective investing requires an ongoing effort. And there’s a lot more to know.
Here are some questions that arise at different stages of life:
Anthony and Selena have a growing family and wonder, “What’s the best way to fund our childrens’ college education?”
Dave and Christine are in retirement. They ask, “Should we change the allocation of our portfolio now that we’re no longer working?”
Rebecca is a single woman with a small business. She wants to know, “My business is finally doing well; what’s the best way to put my extra income to work for my family’s future?”
Isaac likes to do research online. He asks, “Does it make sense to watch the market every day and trade on what happens there?”
Answers will depend on each unique situation.

